Daily AI signals for every stock in your universe.

An individual ML model per equity scores expected return across 5,000+ stocks, ranking the under- and out-performers of your universe at 1- and 3-month horizons, every day, and explaining each call.

One model per stock, scored again every day. Ranked across the universe, at one and three months, with the factors behind every call.

A systematic ranking engine for your entire universe.

Every name gets a per-stock forecast and a score, ranked by expected relative performance over your horizon, so the strongest and the weakest surface at a glance.
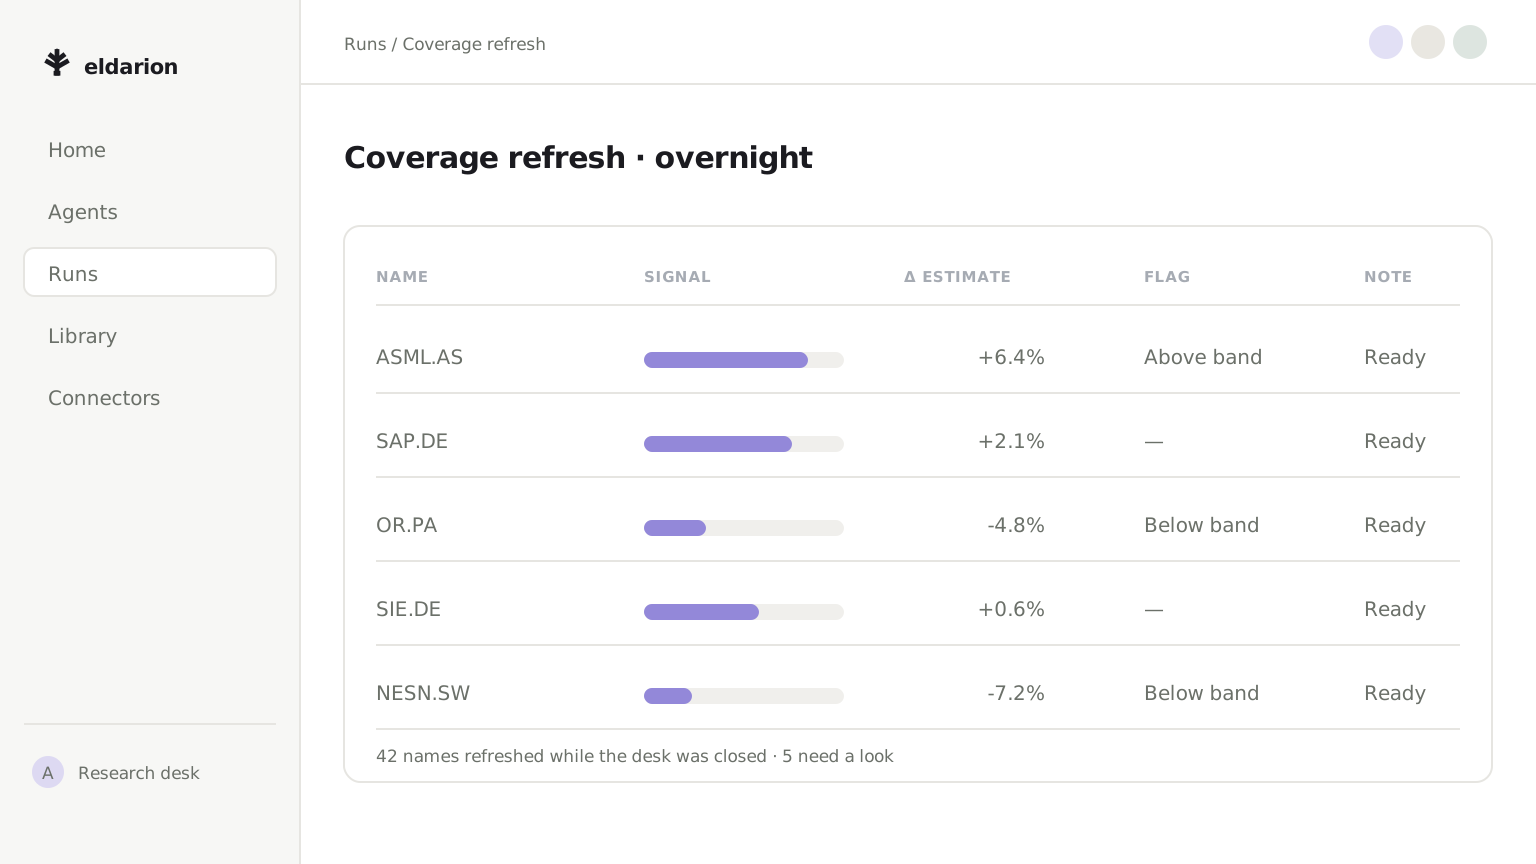
An overnight coverage refresh: the whole universe ranked by what moved

Every name scored, not just the watchlist

The whole coverage universe is ranked each day, so a name nobody was looking at can still come up.

Ranked by expected relative return

Scores are comparable across the universe at the horizon you work to, at one month and at three.

From the ranking into the ticker

Any line opens on the name itself: its forecast, its accuracy and the factors that moved it.
From vast data to a focused model.

Thousands of candidate features per asset are cut down to the ones that genuinely move performance, and each asset keeps the model that predicts it best.

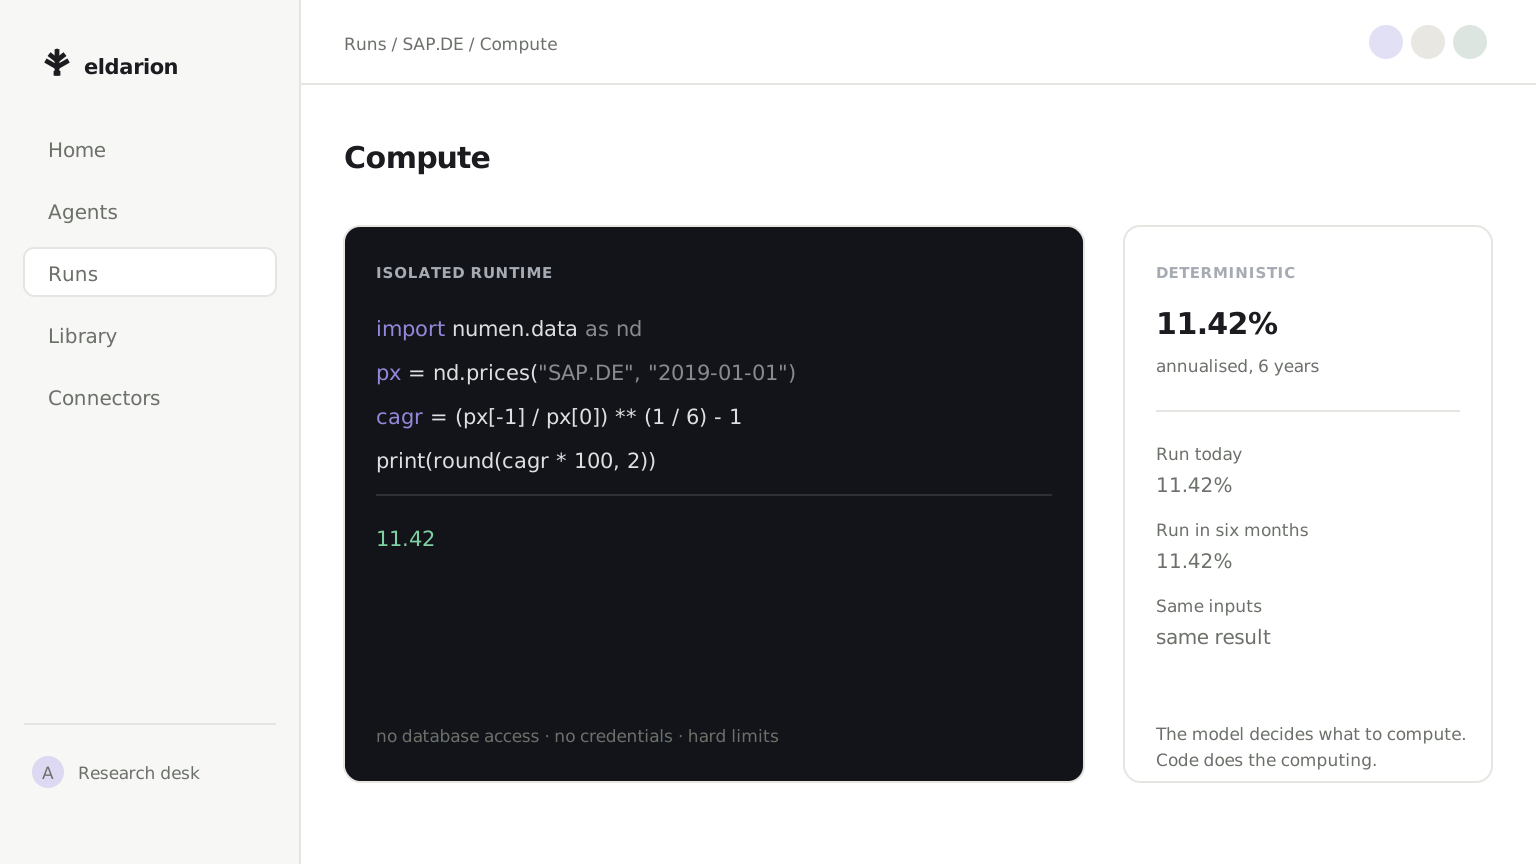
The compute screen behind a run: the features it was fitted on, the windows it was validated over and the accuracy that came out

Four families of inputs

Macroeconomic, market, asset-specific and technical data, aligned and engineered into candidate features per asset.

Noise stripped before training

Redundant and unstable features are dropped, leaving a focused, high-signal dataset rather than everything that was available.

Time-aware validation, no look-ahead

Models are fitted and validated on strictly past data, so what the accuracy reports is what was genuinely predictable.

Every signal, explained.

Each signal ships with the factors that produced it, so a call can be argued in a committee instead of taken on faith.

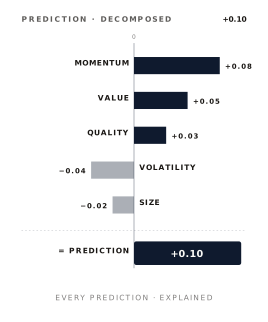
One prediction decomposed: momentum, value, quality, volatility and size, each pushing the expected return up or down

A SHAP breakdown per call

Which factors pushed the expected return up, which pulled it down, and by how much on this name today.

Accuracy travels with the score

Every signal carries how well its model has predicted this asset, so a weak forecast is visible as a weak forecast.

Two horizons, one method

One and three months are produced the same way, so the short and the medium view can be read side by side.

What the desk does with the signal.

The score is an input, not an instruction. These are the ways desks put it to work: against their own universe, their own constraints and their own process, with the factor breakdown attached to every call.

  • Watchlist triage
  • Screening the universe
  • Ranking a sector
  • Long and short candidates
  • Position sizing
  • Pre-trade sanity check
  • Portfolio tilt
  • Risk overlay
  • Idea generation for the committee
  • 1-month horizon
  • 3-month horizon
  • SHAP factor attribution
  • Model accuracy per asset
  • Your own universe
  • Your own horizon
  • Your own constraints

Send us the universe you cover and we will run the signals over it, so the first thing you see is your own names ranked rather than a demo book. Write to admin@eldarion.ai.